


August 26, 2026 | 6 Minute Read
Key Takeaway
In our view, the concentration of investment growth in AI-related sectors is a concern, more so than the level of investment in the economy.
In recent quarters, markets observers have debated how dependent US growth has been on AI capex. At PPM, we use a top-down view of the macroeconomy to assess the US’s reliance on AI-related investments. As part of this analysis, we also compare this cycle to the Telecom capex cycle of the late 1990s/early 2000s.
The Economic Impact of AI-Related Capex
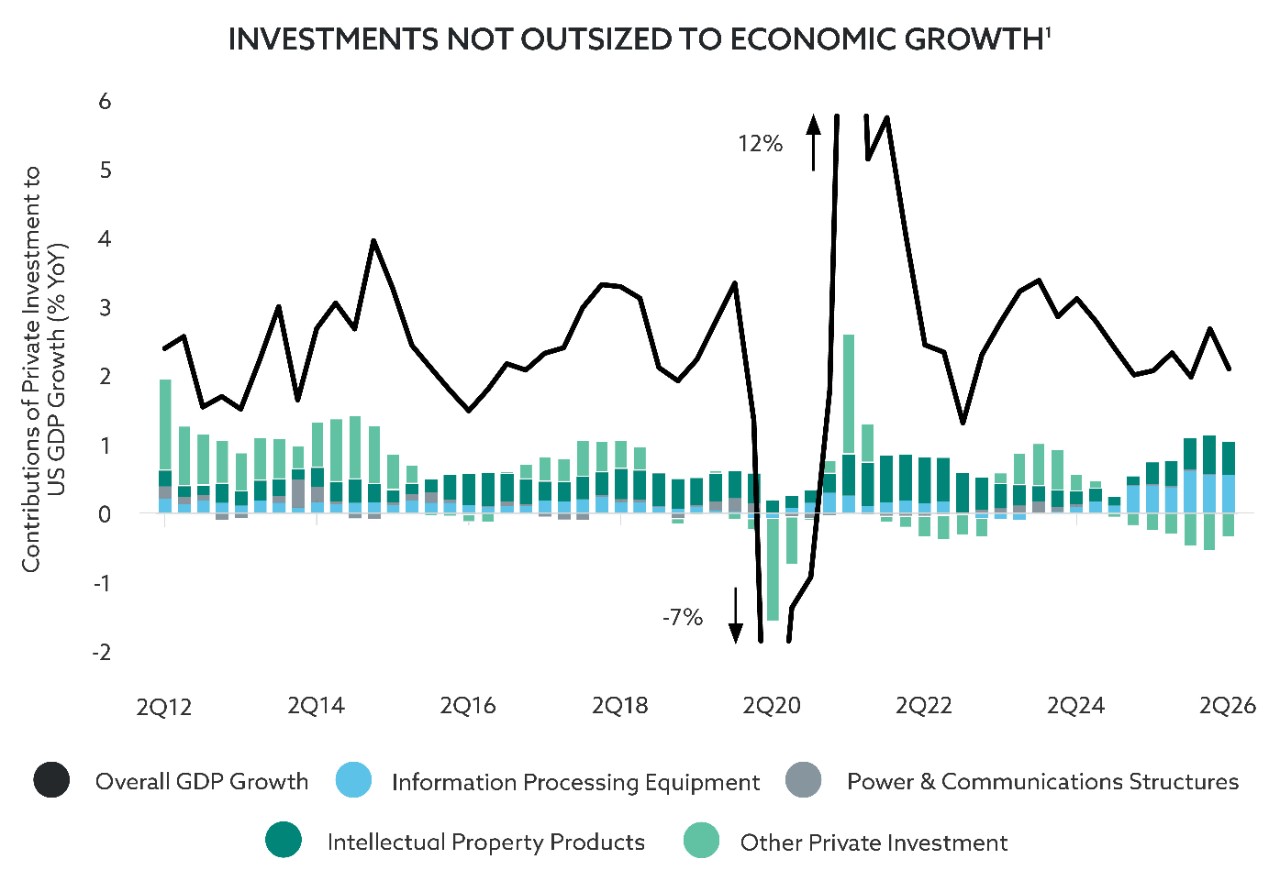
As the chart below indicates, aggregate private investment is not an outsized contributor to recent economic growth, even as the contributions of the AI-related sectors (as represented most closely by the information processing equipment contributions) have increased. That may seem counterintuitive given the headlines touting the large amounts of capital being spent on the AI buildout. However, readers should note that the investment figures used in the first two charts exclude semiconductors, which are not considered capital goods by official government data sources. Rather, they are categorized as consumption goods and generally as part of imports which are netted out of overall GDP calculations. We estimate semiconductor spending to be in the order of ~1% of GDP over the last 12 months. Instead, consumption remains the largest driver of growth in the US economy.
Additionally, overall investment levels have remained relatively flat over the past three years even as AI-related capex has ramped up, staying between 17.6% and 17.9% of GDP. The lack of increase is due to residential and non-AI, non-residential investments both contracting in economic importance. This dynamic contrasts with the Telecom capex boom (centered around the late 1990s/early 2000s) where aggregate investment grew sharply and more broadly.
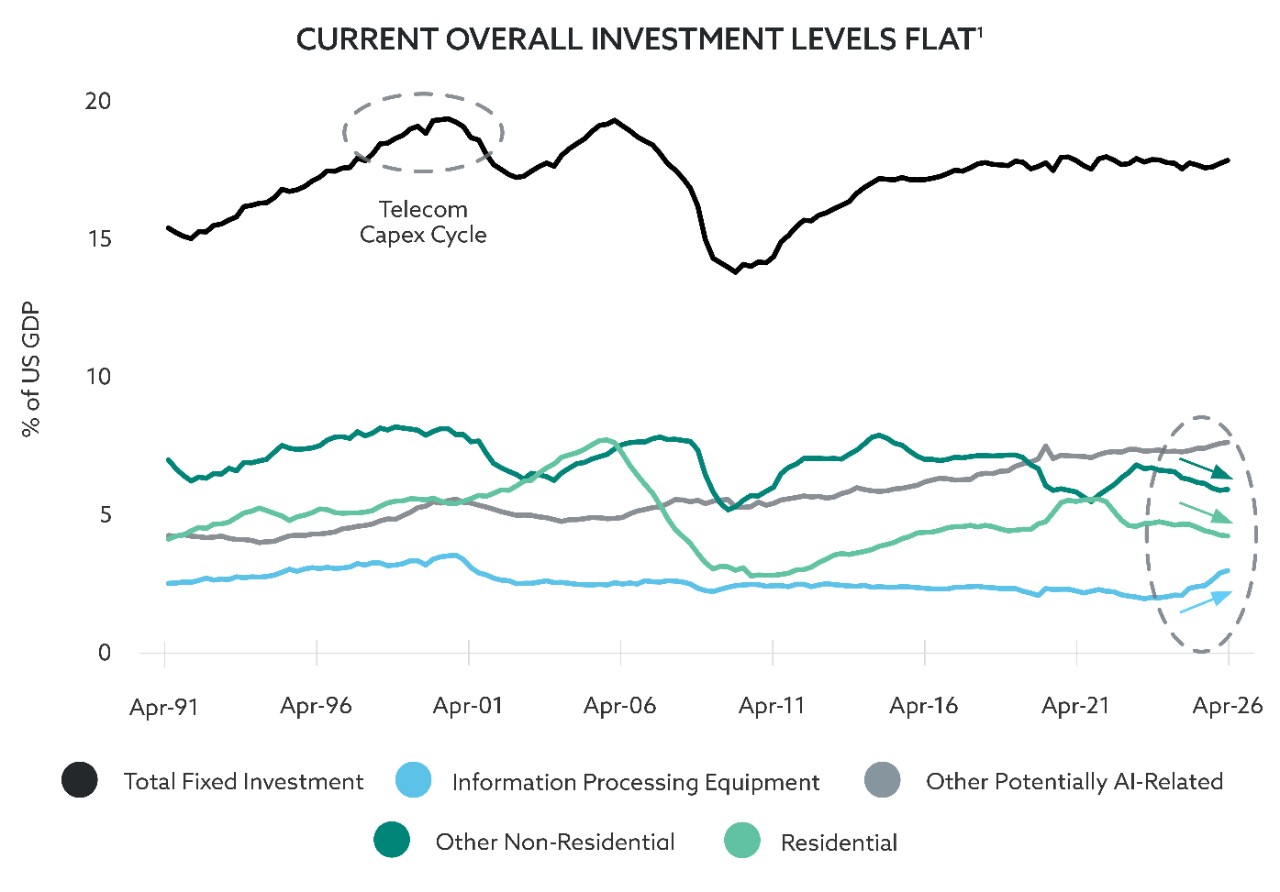
While it's possible that AI is crowding out other areas of investment, the weakness in non-AI investment is probably real. Residential investment, for example, is likely entrenched in the current rate environment. Besides rates, uncertainties around US policy, as well as AI itself, may also be dampening non-tech investment. Given that investment activity tends to drive the broader economic cycle, the concentration of investment growth in AI-related sectors is a concern to us, more so than the level of investment in the economy. Finally, we view consumption growth as also more narrowly-driven than in the past. Higher-income households currently account for a historically high share of spending, as they have benefited from surging equity markets, which are themselves closely tied to AI.
Historical Analogue: The Telecom Capex Cycle
Historical parallels to the current AI capex cycle are few, and data is limited for most. However, we view the Telecom buildout as a relevant comparison.
After aggregating investments across multiple types of equipment and structures, we see that peak Telecom investment levels in 2000 were 6.6% of GDP, almost two percentage points above the run rate prior to the build out in the early 1990s. This peak took roughly five years to reach. Today’s AI build out sits approximately one percentage point above pre-ChatGPT levels – or less if one accounts for the upward trend through the 2000s and 2010s – and we are roughly two and half years into the ramp-up.
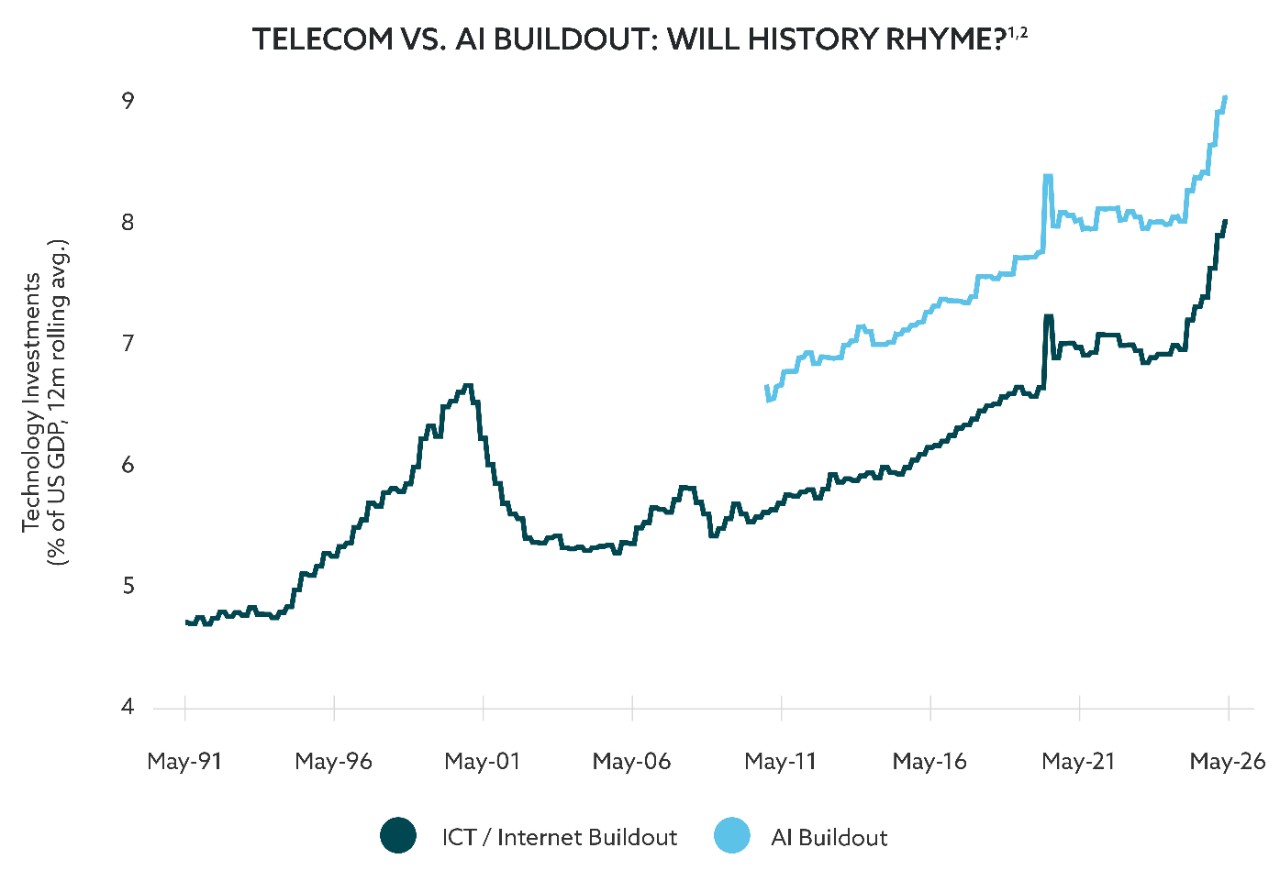
If we accept the Telecom capex cycle as analogue, this chart has two cross-cutting implications: 1) significant potential to increase AI capex may exist, given the level and duration of the Telecom buildout; and 2) a steep drop in investment several years from now could follow. That said, the US recession of 2001 was quite shallow and short, much more modest than the steep decline in investment, as consumption growth remained quite solid.
Overall, the recent US growth does not appear to be more investment-driven than it has been historically. However, the concentration of investment activity in AI-related sectors is elevated, suggesting that broader economic growth may have heightened sensitivity to fluctuations in AI capex. In our view, the Telecom capex cycle provides a useful comparison: it suggests there may still be room for further investment growth, but also that a subsequent retrenchment could be significant. While the end of the Telecom capex cycle produced only a mild and short-lived recession in 2001, today’s lower base of consumption and non-tech investment growth suggests a deeper downturn is possible if the current cycle ultimately produces a similar degree of overbuilding. Notwithstanding that cyclical risk, we expect these investments to support meaningful AI-related productivity growth over the coming decades.

(1) US Bureau of Economic Analysis, Macrobond and PPM calculations. 11 August 2026. (2) Both series include communication and information processing equipment and structures, as well as software and R&D investment. The AI series also includes electrical equipment/structures and semiconductor imports.
Unless otherwise stated, the information presented has been prepared from market observations and other sources believed in good faith to be reliable. Information and opinions expressed by PPM are current as of the date indicated and are subject to change without notice. Forward-looking statements are subject to uncertainties that could cause actual developments and results to differ materially from the expectations expressed.
Past performance is no guarantee of future results. Investments involve varying degrees of risk and may lose value.
© 2026 PPM America, Inc. All rights reserved.

