


October 13, 2026 | 4 Minute Read
Key Takeaway
We expect income growth to offset negative leverage and keep CRE market valuations roughly flat.
Valuations are a critical barometer of health in the US commercial real estate (CRE) market, shaping transaction activity and investment returns.
During the Global Financial Crisis, CRE market valuations dropped approximately 35%.1 Then, during the recovery phase, the market averaged high-single-digit annual increases from 2011 through 2021.
The rate hiking cycle in 2022 and 2023 halted the CRE recovery, as the fed funds rate increased by 525 bps. With higher market interest rates, CRE valuations decreased by more than 10% during this period, with a notably larger decline for office properties in central business districts affected by the work-from-home trend. CRE valuations have increased only modestly since hitting a low in early 2024, remaining about 10% below their 2022 peak.
CRE valuations have three major components: income growth, cap rates and leverage. Income growth has generally been positive over the past two years. Absent a broad economic slowdown, we project slow-to-moderate income growth over the next 2-3 years.
Cap rates and leverage trends have been less supportive. They are somewhat related, with the CRE market benefiting during periods of positive leverage (cap rates above debt financing costs). From 2010 through 2021, cap rates exceeded debt costs by about 140 bps on average.2 Since 2022, that spread has narrowed to roughly zero and at times has turned negative. To illustrate:
- At times in the prior decade, an investor could purchase a property at a 4.50% cap rate, compared to debt financing at 3.50%. If that spread of 100 bps was leveraged at 65%, the investment could earn a return on equity in the first year of approximately 6.40%.
- Today, we are seeing the potential for negative leverage, with a hypothetical investor buying at a cap rate of 5.50% and financing with a fixed rate of 6.25%. Under that scenario and applying 65% leverage, the negative spread reduces the implied first-year return, from the cap rate of 5.50% to a return on equity of about 4.10%.
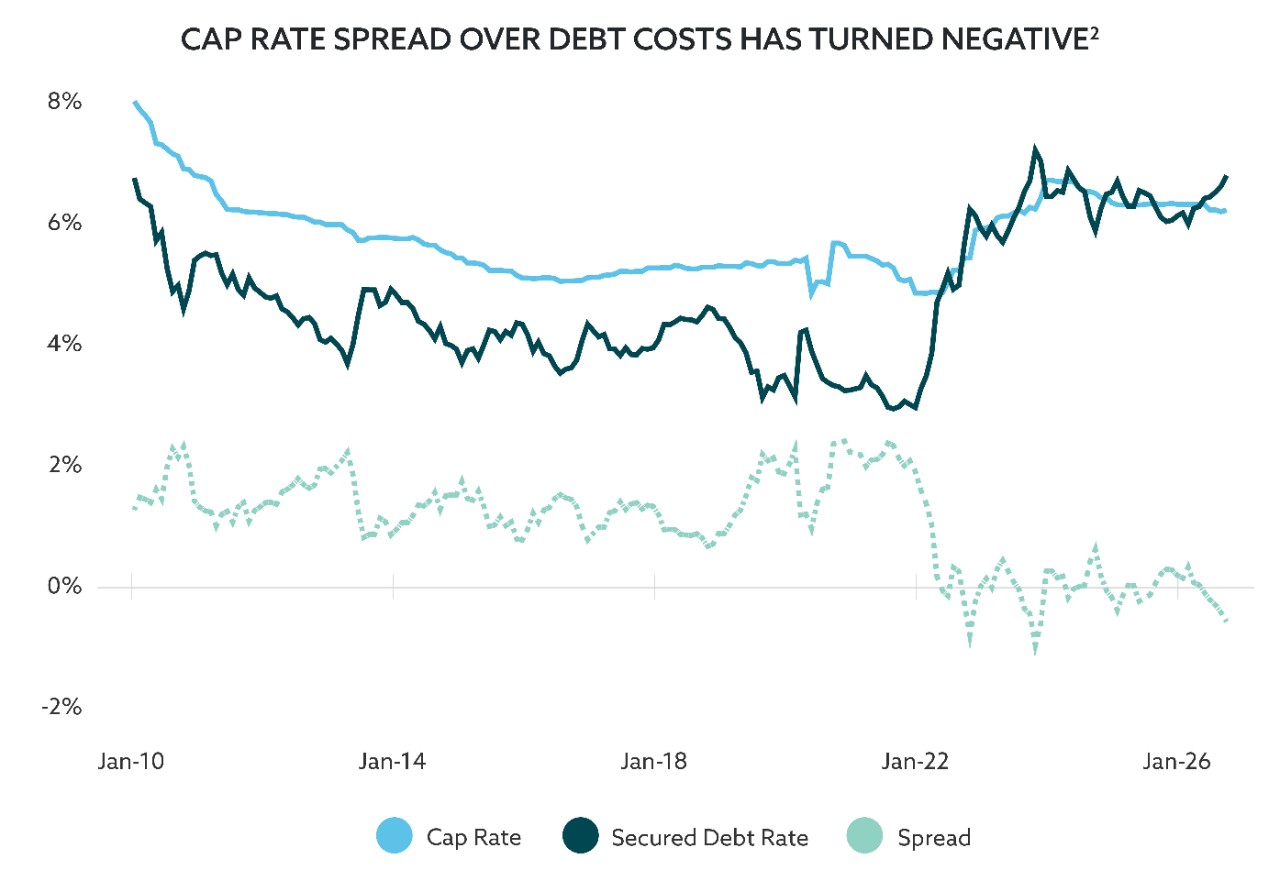
The outlook for the CRE market today is uncertain given the current negative leverage for many property types. While our expectation is for income growth to offset negative leverage and keep valuations roughly flat over the next 12 months (-5% to +5%), further rate increases could result in a more negative outcome. We expect origination volumes will be pressured, as acquisition activity involving leverage as well as any discretionary debt financing and refinancing slows through year-end. We are closely watching Fed rate movements, consumer health metrics and the continuing return-to-work trend for early signs of an improving CRE market in the medium term. One area we see a potential opportunity is in mid-to-smaller metropolitan statistical areas (MSAs). Those with growth prospects and below replacement cost pricing can offer higher cap rates that provide a positive spread over debt costs.

(1) Bloomberg. 21 September 2026. Based upon the RCA CPPI National All Property Index. (2) Green Street. 3 September 2026.
Unless otherwise stated, the information presented has been prepared from market observations and other sources believed in good faith to be reliable. Information and opinions expressed by PPM are current as of the date indicated and are subject to change without notice. Forward-looking statements are subject to uncertainties that could cause actual developments and results to differ materially from the expectations expressed.
Past performance is no guarantee of future results. Investments involve varying degrees of risk and may lose value.
© 2026 PPM America, Inc. All rights reserved.

